
How unequal is Canada and does it matter?

 Peter Josty is Executive Director of The Centre for Innovation Studies based in Calgary.
The topic of inequality has been receiving a lot of attention recently. How unequal is Canada, has that been changing, and does it matter?
There are many different ways to measure economic inequality – for income, wealth and for the individual or the household, pre-tax or after-tax income, with or without social benefits, etc.
The World Inequality Report shows the income of the top 10 percent and bottom 50 percent of income earners in Canada, as shown below. This is measured after pension and employment insurance, but before income tax.
Source: World Inequality Report 2026
So, the top 10 percent of income earners earn about 34 percent of total income, making Canada in the middle of the pack of rich countries.
Wealth inequality is much greater – the richest 10 percent own 59 percent of total wealth in the country.
Estimates of income and wealth should not be regarded as very accurate and taken with a big grain of salt, particularly wealth numbers. For example, the Parliamentary Budget Office estimated the net wealth of the top one percent of families using Statistics Canada data in 2023 was 11 percent of total net worth, but using StatsCan’s own High-net-worth Family Database it was 23.8 percent – a huge difference.
What is going on?
Inequality in the period 1900-1940 was very high in Canada, because Canada was industrializing and wealth was concentrated in a small elite. This is typical of how new technologies are adopted as documented by the 2024 Nobel prize winners Acemoglu and Robinson. There were also significant regional differences across Canada as the new industry was concentrated in Ontario and Quebec.
After 1940, World War 2 precipitated several major changes that drastically reduced inequality. These included the increase in demand for labour (raising incomes), the introduction of unemployment insurance and family allowances, increase in taxes to pay for the war effort, and government regulation of wages and prices in key industries.
These factors remained substantially in place until 1980, and inequality continued unchanged.
1980 was a pivotal year that started a 40-year period of increasing inequality. Margaret Thatcher became prime minister in the U.K. in 1979, and Ronald Reagan became president in 1980. This reflected a sea change in thinking about the role of government and the rise of free markets.
This process started in 1970 when Milton Friedman wrote the “Friedman Doctrine” essay stating that “The social responsibility of business is to increase its profits.” This was supported by the view that managers of publicly listed companies should be rewarded according to the amount of shareholder value they created. This led to increasing pay for CEOs and senior managers.
After about 2005, income inequality began to decline modestly in Canada. This was because of several government policies – the introduction of the child tax benefit and increased taxes on high income earners.
How does Canada compare with the U.S.?
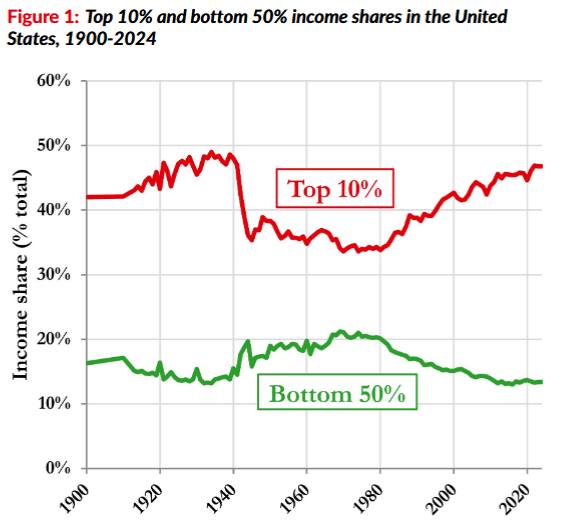
The pattern in the U.S .is broadly similar to Canada with two significant differences.
First, the overall level of inequality has as been much higher in the U.S. than in Canada, at least since 1940. In 2024, the top one percent of income earners in the U.S. earned 20.7 percent of total income, compared with 9.4 percent in Canada.
Wealth inequality is also much higher, as the top 10 percent in the U.S. own 70 percent of total wealth, compared with 59 percent in Canada.
Second, the rise in inequality after 1980 has continued to increase in the U.S., compared with the modest decrease in Canada after 2005. Current U.S. policies look likely to increase inequality there in future years.
Source: World Inequality Report 2026
Across the G7, Canada is in the middle of the pack for inequality measured by income and wealth.
Country | Income share top 10% | Wealth share top 10% | Wealth share top 1% | Wealth share bottom 50% |
Canada | 34 | 59 | 29.3 | 3.8 |
U.S. | 47 | 70 | 34.8 | 1.0 |
France | 34 | 60 | 27.4 | 4.9 |
Germany | 37 | 58 | 27.7 | 3.4 |
Japan | 43 | 59 | 24.2 | 4.7 |
Italy | 32 | 56 | 22.1 | 2.5 |
U.K. | 36 | 57 | 21.3 | 4.6 |
Source: World Inequality Report 2026.
The most unequal country in the world is South Africa, where the top 10 percent have 66 percent of the income, and own 86 percent of the wealth; the bottom 50 percent own -2.5 percent of the wealth.
Why does inequality matter?
A paper from the London School of Economics International Inequalities Institute says the reasons why inequality is bad can be broken down into three groups:
- Economic reasons
- Reasons of fairness
- Political reasons
A recent article in The Economist, titled “The Robin Hood state is coming for the rich” (February16, 2026), points out that there has been a countervailing trend: as pre-tax incomes have become more unequal, tax codes have become more progressive.
The effect has outweighed the growth in inequality in much of the rich world, even in the U.S., where after-tax inequality is not much higher than it was in 1986.
It is much harder to avoid paying tax now than in the post. The effective income tax paid by the top one percent in Canada (including provincial taxes) is 39 percent, and in Britain is almost 40 percent.
This idea is supported for Canada by a paper published in the World Inequality Database (below). While the after-tax income of the top 10 percent and top 40 percent is lower than the pre-tax income, the opposite is true for the bottom 50 percent. The share of post-tax income for the bottom 50 percent is not much different in 2020 than it was in 1980
Canada pre-tax and post-tax income
The paper also points out two significant ways in which tax data don’t capture all aspects of inequality and could miss up to one-third of total income.
First, 10 percent to 12 percent of adults in Canada don’t file a tax return, so their income is not included.
Second, profits retained in corporations are not reported in personal income tax data, and this income goes mainly to high-income earners.
The consequence of this re-distribution is that the top one percent of income earners pay a very large proportion of income tax collected.
In the U.S., the top one percent pay 40 percent of all income tax, similar to South Korea. In Britain it is 27 percent and in Canada it is about 23 percent.
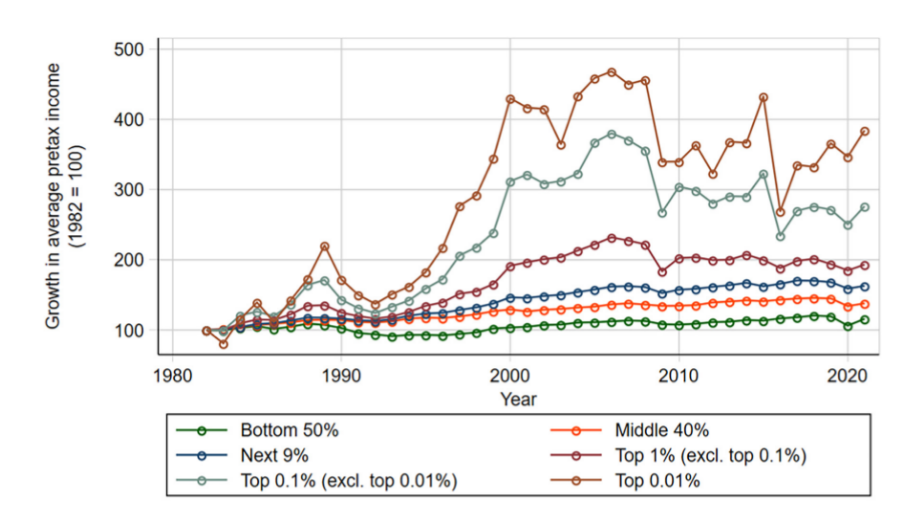
Despite these averages, there is one area where inequality has increased significantly – the higher your income, the more it has gone up (from 1982 to 2021).
The graphic below shows this for various income groups. For example, the income of the bottom 50 percent has increased by 15.8 percent in this time period; the income of the middle 40 percent has gone up by 37.9 percent; the income of the top 0.1 percent has gone up by 177.8 percent; and the income of the top .01 percent by 297.3 percent.
Growth of income by income group – Canada 1982 -2021
Source: World Inequality Database paper
Conclusion
Measuring economic inequality in a meaningful way is complicated and prone to misinterpretation. The data should be taken with a grain of salt, particularly for high-income earners.
The most comprehensive information says that, overall, Canada’s inequality hasn’t changed that much in the last 40 years. However, a small group of Canadians has become much richer.
Pretax income has become much more unequal in recent years, although there has been an improvement in Canada recently. After-tax income overall has not changed nearly as much. Canada’s inequality is in the middle of the pack of rich countries. The higher your income, the more it has gone up in recent years.
Rising wealth inequality slows economic growth, deepens political polarization, reduces social mobility and strains public finances. It restricts lower-income households from accessing quality education, health care and housing, which compounds disparities across generations.
Rising inequality also causes problems as some extremely rich individuals become politically active, giving high-wealth individuals and groups disproportionate influence over public policy and laws.
The influence over the Trump administration of Elon Musk and the CEOs of Big Tech corporations, including the Big Five (Alphabet, Amazon, Apple, Meta, and Microsoft), are examples in the U.S.
As a report by Brookings stated, “An increasingly unequal society can weaken trust in public institutions and undermine democratic governance.”
R$
| Organizations: | |
| People: | |
| Topics: |



.jpg)
Events For Leaders in
Science, Tech, Innovation, and Policy
Discuss and learn from those in the know at our virtual and in-person events.
See Upcoming Events
You have 0 free articles remaining.
Don't miss out - start your free trial today.
Start your FREE trial Already a member? Log in
By using this website, you agree to our use of cookies. We use cookies to provide you with a great experience and to help our website run effectively in accordance with our Privacy Policy and Terms of Service.